")


Analytics.
We all know how extremely important those are, don’t we?
Instagram is the only social media network that doesn’t have analytics built-in to it’s system.
However, there is a platform that we can use to easily keep track of our Instagram Analytics.
ICONOSQUARE.
Okay, first things first. You will need to sign up for Iconosquare. You can do that here. It will take at least one week to gather your analytics for your first reading, but after this it will refresh regularly. This amazing program offers a free 7 day trial and they have currently upped their pricing to a whopping $2.40 per month to track analytics. I think that this is a more than fair price – considering all of the amazing info it shows us.
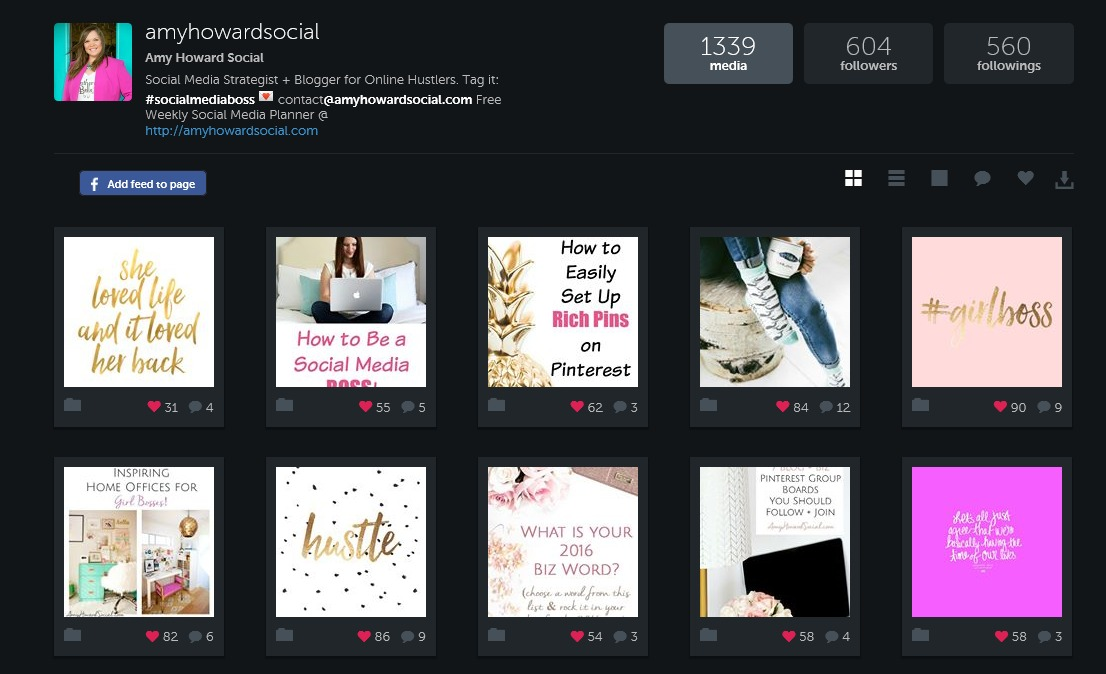
This is what your VIEWER PAGE will look like – aka the home page. You can adjust the look of your layout to your liking.
ANALYTICS OVERVIEW:
Iconosquare is amazing for MANY reasons – it’s main special ingredient is the Analytics tracking. To get started digging into your analytics click on Analytics at the top of your page. If you want to quickly check your stats then your dashboard provides you with a set of simplified metrics for the last 7 days. Love Rate, Talk Rate and Spread Rate give you an instant snapshot of the success of your latest photo compared to your 15 day average. If the larger number in those three tools is more than the small number, which is the average, then you know your latest post was a success. 🙂
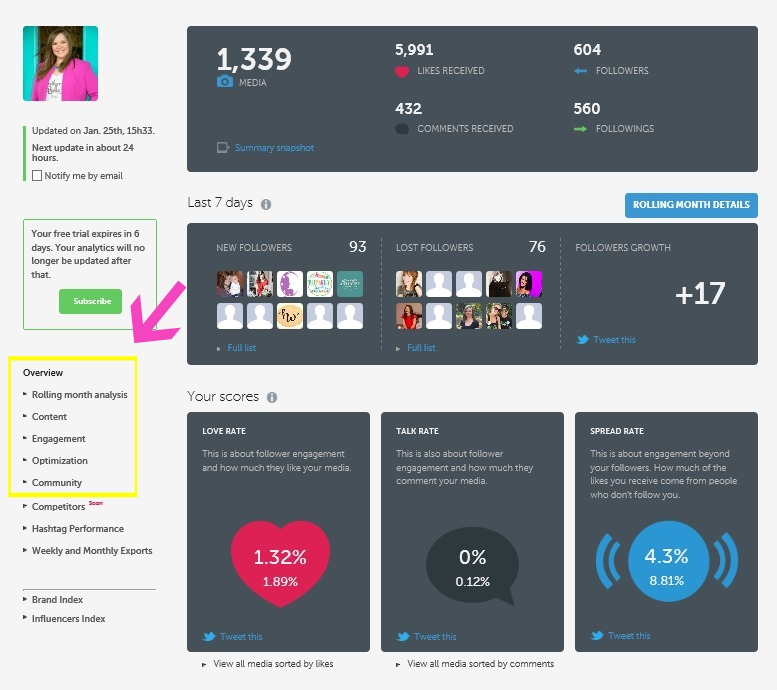
I will be covering these analytics categories that you will find on the left side of this image.
ROLLING MONTH DETAILS:
This is where you can track your analytics for the past month. Here you can view specific stats for photos and your followers. You can also see your most engaged followers for the last month so you can identify your biggest fans and easily follow them back if you want to. I would totally suggest following your most engaged followers. 🙂 Remember to be social!
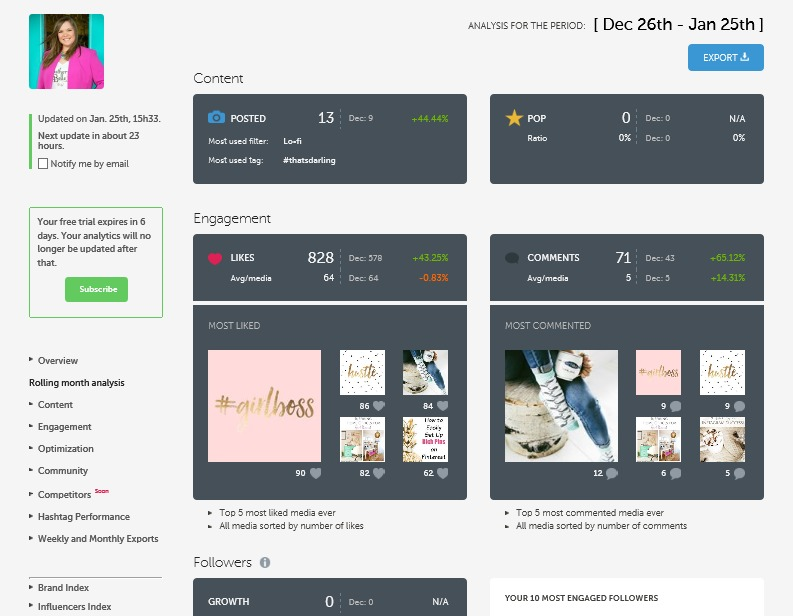
CONTENT:
Here you’ll find information about your own Instagram habits, for example what time of day you typically post your photos and which filter you are most likely to use. Check out my sweet little superhero – my first ever Instagram post in 2012! {be still my beating heart} <– y’all know that this photo of my babe was posted before I started using Instagram as a biz account – I totally don’t recommend mixing photos of personal and biz unless it relates to your biz. Don’t hate – I am a picture mom too, I understand the struggle. 🙂
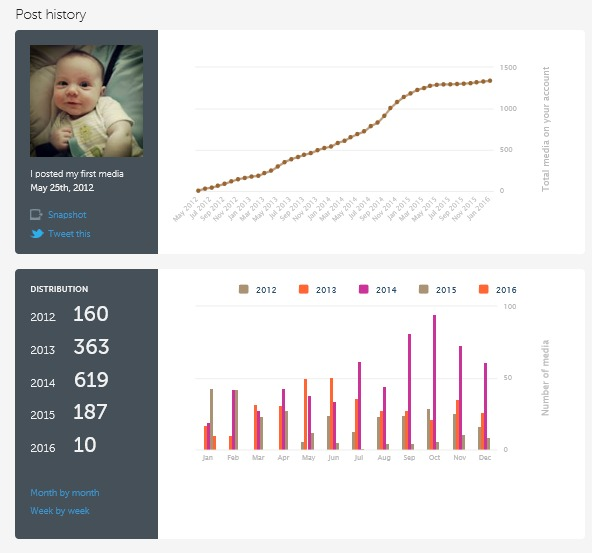
We also see here that #thatsdarling seems to be my favorite hashtag and I like the filter Amaro.
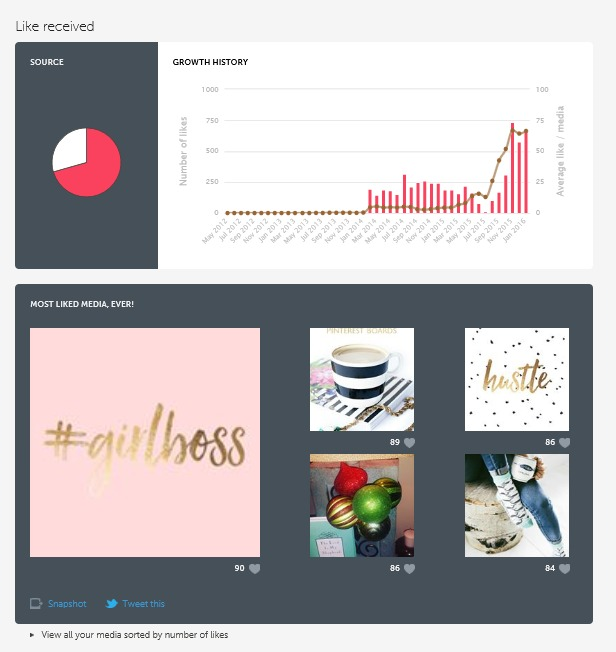
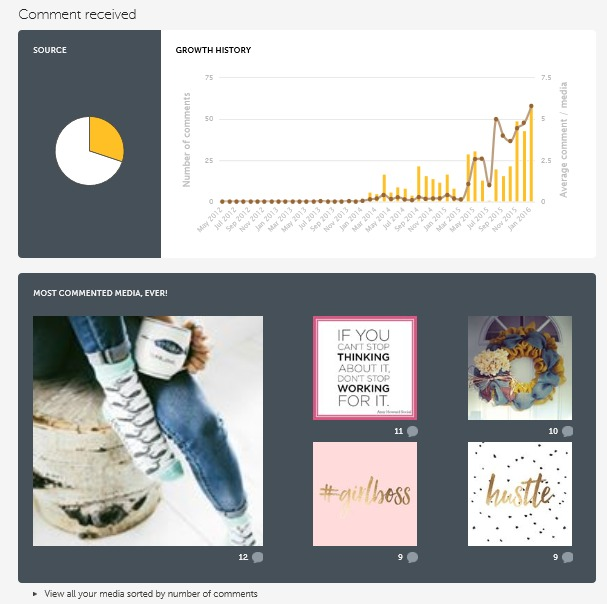
ENGAGEMENT:
The Engagement panel gives a lifetime overview of your stats. Quickly refer to your most liked and most commented on photos to find out what your followers want to see more of. Pretty awesome right?!
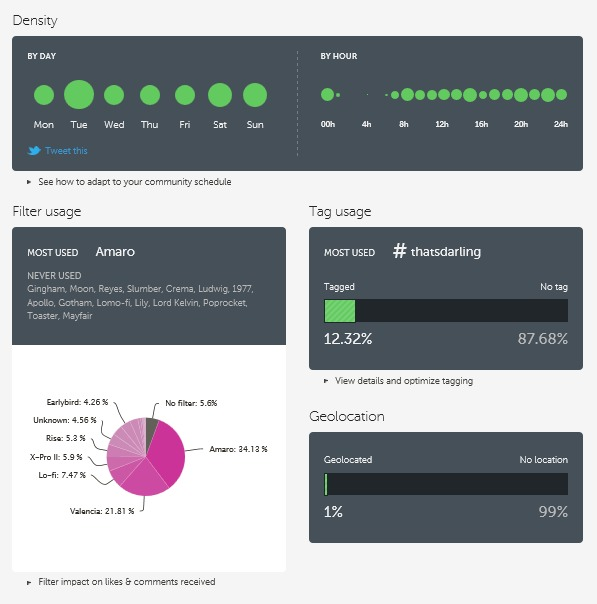
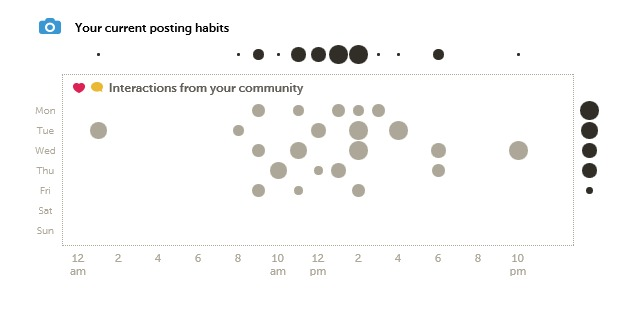
OPTIMIZATION:
This section is my favorite for two reasons. It will show you the perfect time for you to post on Instagram, based on when your audience is the most interactive with your content, holla! This is huge y’all. The dark rounds indicates when you usually post media (repartition by hour horizontally, and by days vertically). The light grey rounds shows when your community has been interacting. The biggest light grey rounds are the best times for you to post.
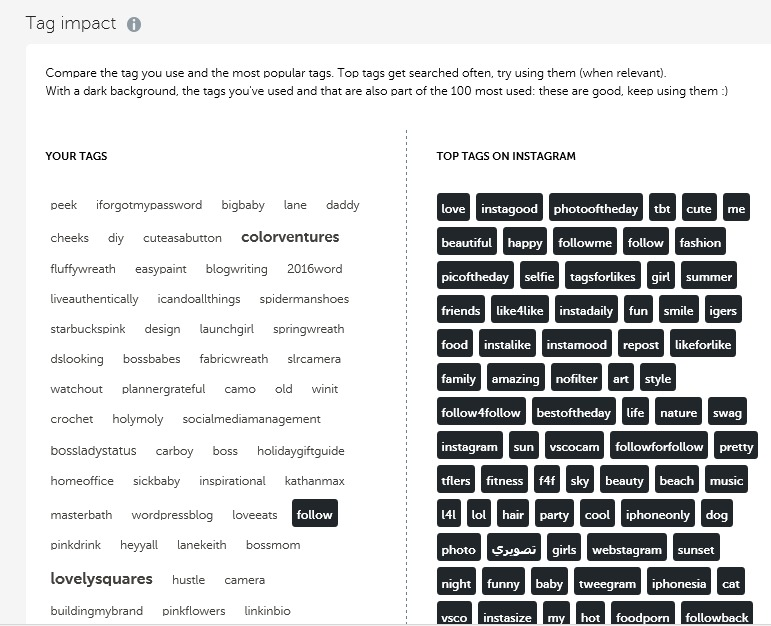
The Optimization section also compares your most used tags with the ones that are most popular across the whole Instagram platform. Compare the tag you use and the most popular tags. Top tags get searched often, try using them (when relevant). With a dark background, the tags you’ve used and that are also part of the 100 most used: these are good, keep using them 🙂
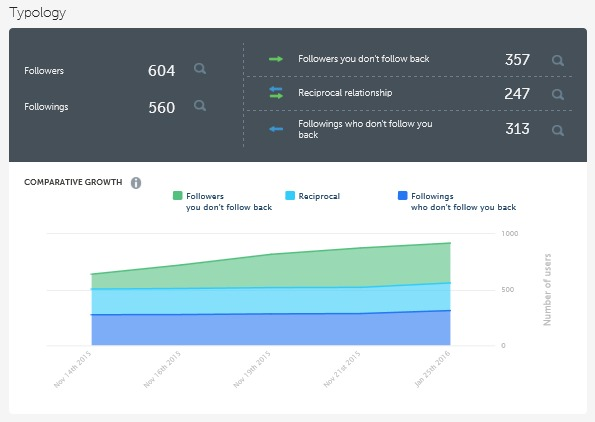
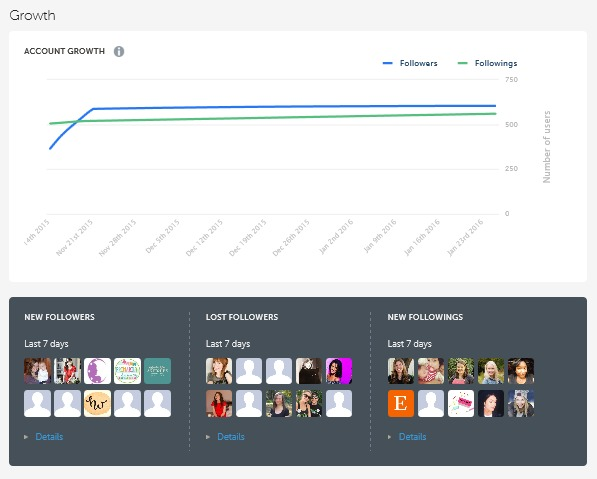
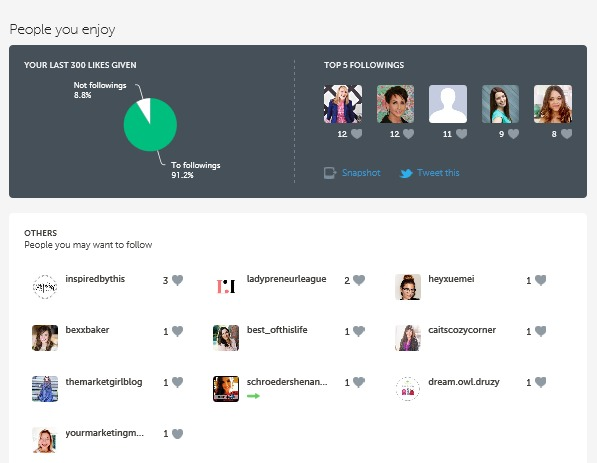
COMMUNITY:
This is the final section in Iconosquare’s statistics and it will show you your all important follower growth stats. Here we can see who has followed us, why we have followed and not followed, and others that we might want to follow. It is all about our Community. 🙂
So in a nutshell, this is a simple breakdown of How to Use Iconosquare to Track Instagram Analytics. I hope that you will consider spending $2.40 per month on this snazzy platform because it really is the bees knees.
Do any of you currently use Iconosquare? If so, what do you enjoy most about it?
If you don’t yet, how many of you will be signing up?
Now, let’s be Instagram Besties: you can find me on Instagram @ Instagram.com/amyhowardsocial
Tag It: #socialmediaboss so I can find your beautiful posts!!
DON’T FORGET IT : PIN IT!


")
[…] Read full story […]